A short history of higher taxes
There is always a lot of rhetoric on Tax Day. Later I will comment on some of today’s rhetoric. In this post I will instead focus on some basic facts that are not earth-shattering, but provide some important historic context for the current tax and spending debate.
Let’s start by looking at just the total amount of taxes collected by the Federal government over time, adjusting for inflation.
")
You can see taxes growing fairly steadily over time. The various bumps are a combination of changes in law and economic cycles. Still, even given those factors, the total amount of inflation-adjusted dollars going to the federal government has clearly climbed over time. In real terms, government’s take has gotten bigger.
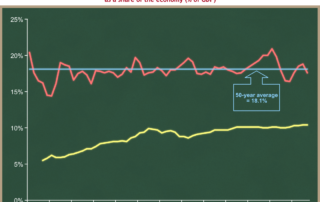
Some argue that we should instead measure total federal taxes as a share of the economy. This presumes that as the economy gets bigger, government “should” get bigger proportionately. I disagree with that view. Some things that government does clearly are related to the size of our population, or are related to other measures of society’s income or wealth. I do not buy that principle as a general matter. Still, let’s look at that perspective.

You can see that the federal government’s take from the economy has remained roughly constant since the end of World War II. The flat line is at 18.1%, and shows that, on average over the past 50 years, Uncle Sam takes about 18.1% out of every dollar earned in America. This graph makes the policy changes and economic fluctuations easier to see. For instance, you can see the effects of the 1993 reconciliation bill (which raised taxes), plus the economic growth of the 90s, ending in the stock market “bubble” (I use that term loosely) in 1999 and 2000 with phenomenally high capital gains revenues, followed by the stock market decline and recession in 2001 and 2002, combined with the effects of the 2001 tax cuts.
There’s actually a slight upward trend to this line. If you look at share of GDP since the end of World War II, the average is 17.9%. If you look over the past 50 years, it’s the 18.1% I have displayed on the graph. Over the past 40 years, it’s 18.3%, and over the past […]