Deficits and debt under the President’s budget
There has been a lot of debate about whether the President’s budget improves or worsens the future deficit picture. This is a debate mostly about baselines – what do you assume would happen otherwise? Rather than engaging in that debate here, I am going to look at the results of what the President has proposed.
What would federal deficits and debt held by the public be if the President’s budget were to become law exactly as proposed?
We will look at it both from the Administration’s point of view, and from that of the Congressional Budget Office, which serves as the referee for Congressional legislation. While the two differ in some respects, the fundamental conclusions are the same.
We will begin with spending. You can see from this graph that CBO and OMB agree precisely on how much the President’s budget would spend over the next ten years.

Now we turn to revenues. The President’s budget assumes faster economic growth than does the CBO. A bigger economy leads to more revenues for government, so OMB assumes more revenues from the same set of policies as CBO.

Don’t be fooled by the scale of the graph. That’s a $500 billion difference in 2019.
It is this difference in revenue assumptions that leads OMB to have a more optimistic deficit forecast for the President’s budget than CBO. I am going to put the proposed deficits in historic perspective, and switch to % of GDP so we have a fair comparison over a long timeframe.

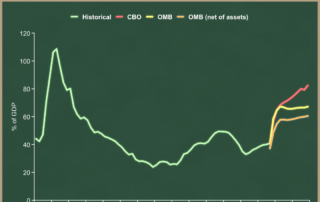
The light green line shows historic deficits (above the line). The light blue line shows the post-World War II average deficit of 1.7% of GDP. Red is the CBO’s estimate of deficits under the President’s budget, and yellow is the Administration’s estimate. The gap between the two is because of different assumptions about GDP growth leading to different estimates of future federal revenues.
I find it more interesting and worrisome that both estimates show annual budget deficits for the next decade that far exceed historic averages. The Administration’s estimate hovers around 3.0% of GDP, while CBO’s estimate climbs steadily to 5.7% of GDP by the end of the decade. Neither is anything to brag about.
Now let us look at the effects of the President’s budget on debt held by […]