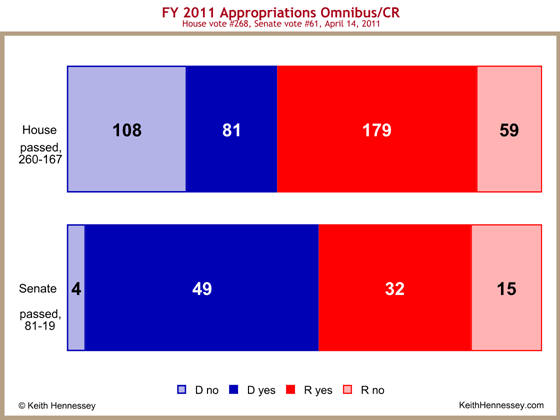
Here is the partisan breakdown for the House and Senate final passage votes on the FY11 appropriations law.
Light shading shows the number of no votes, dark shading the number of aye votes. As always, you can click on the graph to see a larger version.
Note the difference between House and Senate Democrats. I also find it interesting that a greater percentage of Republican Senators (31%) voted no than Republican House members (25%). I would not have guessed that in advance.
Also note that most of the House votes came from Republicans, while most of the Senate votes came from Democrats. This reflects the reality that the majority party in each body almost always provides most of the aye votes for final passage.
