The long term budget problem begins now
Let’s look at President Obama’s proposed long run budget path. Click the graph to see a larger version.
<a href=”https://keithhennessey.files.wordpress.com/2013/01/obama-long-term-policy.png” target=”_blank” rel=”shadowbox[post-7070];player=img;”>
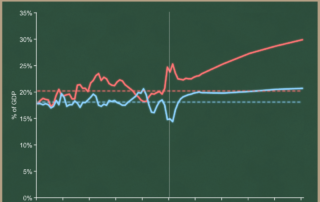
I am comparing the past 50 years with the next 50 years under President Obama’s proposed policies.
The dotted red line shows us that, over the past 50 years, federal government spending averaged just over one-fifth of the economy (20.2% of GDP). The dotted blue shows us that, over the past 50 years, federal revenues averaged just over 18% of GDP. The small yellow double arrow between the dotted red and blue lines shows the average deficit over the same period: 2.1% of GDP.
The vertical white line at 2011 separates the past from the projected future of the President’s policies.
You can see the assumption of the economy recovering as the blue revenue line recovers from an extraordinary low share of GDP. As more people get jobs, the government will get more income and wage revenues. You can also see spending declining from the 2009-2011 phase which spiked principally because of TARP and stimulus.
Three things should jump out at you from the future portion of this graph:
- The red and blue lines diverge enormously, and the gap grows over time.
- The blue line is flat while the red line slopes upward.
- Both the red and blue lines shift upward significantly.
Let’s take each in turn.
The red and blue lines diverge enormously, and the gap grows over time.
The gap between the red and blue lines is the budget deficit. A deficit of 3% of GDP will hold debt constant relative to the economy. Under the President’s policies the deficit would dip in 2018 to 2.9%, and would otherwise forever be at or above 3%. Our government debt burden will increase forever.
In a crisis our economy can handle an enormous temporary budget deficit. Our deficit problem is that future deficits are large, sustained, and projected to grow forever. Our little yellow double-headed deficit arrow will grow into a monster and keep growing.
The blue line is flat while the red line slopes upward.
Taxes grow as a share of the economy very slowly. The blue line is basically flat for two decades.
I’d like the solid blue line to be below the dotted blue line. Most Congressional Republicans argue to match the historic average of about 18%. The President proposes just below 20%. Reverting the tax code to pre-Bush policies (“repealing all the Bush-Obama tax cuts”) would bring us to the high 20s. In each […]